Overview

The strong heat of this summer did not bring only misfortune. Our bad memories of summer vacationers are fading to keep only the good ones, those of glorious weather outside the heat wave. We are now afraid of being cold at 19°C, the maximum temperature recommended by the government to face the risk of cuts this winter… The thermometer indeed affects our mood and our well-being. Yes, but to what extent? To find out, we would also need a sentiment thermometer. That’s good: we have one, and even several, which we can then link to the ambient temperature and the sunshine of the moment.
The first thermometer of this kind was imagined by a famous Irish economist, Francis Ysidro Edgeworth. He conceived it on paper in the early 1880s in his masterwork Mathematical Psychics. His “hedonometer”, as he calls his psychophysical machine , records the height of the individual’s pleasure according to the “quivering of his passions”. It is equipped with a sort of seismograph needle which oscillates around zero when the person is bored, until it tends almost towards infinity too rarely. Edgeworth then sought to arm economic theory with an instrument for measuring the utility, or satisfaction, of individuals.
Much later and with less theoretical ambition, psychologists but also economists looked into the determinants of happiness with a very simple method: ask individuals to express their satisfaction with life, for example according to a scale from 1 to 10. This hedonometer of subjective well-being was used to estimate the influence of many variables such as income, level of education, number of friends, wealth of the country, etc .
It was also used almost half a century ago to measure the influence of good weather . 84 students from the University of Illinois (USA) were interviewed. Those called on the telephone during the first days of sunshine after a period of gloomy weather declared themselves to be more satisfied with their life than their comrades questioned during a rainy day following a period of bad weather.
Physiological and social benefits
There is nothing surprising in this result, but it is a little boring because it biases the evaluation of life satisfaction by means of a transitory variable, which is intended to be an overall assessment of the happiness of individuals over the duration.
Moreover, two possible causes can be invoked without being able to disentangle them. The first is physiological. Brightness affects the level of serotonin, a neurotransmitter often called the happiness hormone. Or rather would act because the evidence is still lacking. Dosing serotonin requires a sample of cerebrospinal fluid, a medical procedure to avoid without good reason.
The other explanation for the beneficial effect of the sun is social. The good weather facilitates pleasant outdoor activities, shopping or the beach for example. The two causes undoubtedly come into play in general and even simultaneously when one finds oneself in good weather among friends seated on the terrace of a café or with family during a picnic in the countryside.
In any case, it is now well established that sunny weather has a positive influence on happiness, for many Western countries such as the United States, Canada , Germany , and Australia . But this influence remains modest compared to other variables tested such as living with a partner, having a job or not suffering from a disability. In reality, we probably even tend to overestimate the influence of the sun. Daniel Kahneman, the only Nobel Prize-winning psychologist in economics to date, for example, showed that students at the University of Michigan, where the weather is often rainy, tended to place more importance on the climate . to explain their well-beingthan those of the University of California, and vice versa.
[ More than 80,000 readers trust The Conversation newsletter to better understand the world’s major issues . Subscribe today ]
Spurred on by the need to anticipate the effects of global warming, the work for the past twenty years has focused less on good weather through sunshine than on temperature. Let us mention in particular an econometric work carried out on the basis of observations on 67 countries. It unsurprisingly shows a common preference for higher temperatures for the coldest month of the year and lower temperatures for the hottest month. These observations are taken from the World Base of Happiness . Just as happiness economics has become a recognized academic sub-discipline , you may not have guessed that a global happiness database could exist.
Climate preferences
The hedonometer of subjective well-being measuring expressed preferences is moderately appreciated by theoreticians because it is subject to the traditional biases and errors of surveys: influence of the formulation of questions and their order, impressions of the interviewer on the declarant, declaration dependent on the timing, too few respondents, etc.
Hence the design and use of methods that reveal people’s preferences without asking them. The hedonic price method is the most classic. It is used to deduce from indirect observable data the preferences of individuals for off-market goods, therefore without apparent price. For example here, temperature preferences from wages and housing expenses. The intuition being that households agree to pay higher prices and receive lower wages to live in localities that correspond to their climatic preferences, all other things being equal.
A quartet of economists has shown that the willingness to pay is higher to avoid excessive heat than to avoid excessive cold . A trio, using this same method, looked at temperature preferences according to the seasons. Not surprisingly, they lean towards mild winters and moderately hot summers . Again unsurprisingly, it appears that this trait is all the more marked the older the person. The bad luck is that in general regions with mild winters experience hot summers…
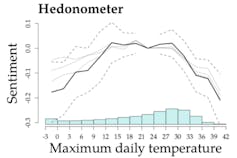
The toolbox of revealed preferences has recently been enriched with a new hedonometer thanks to the ingenuity of a young American economist, Patrick Baylis. He managed to draw the curve of our happiness according to the temperature thanks to a machine of his invention.
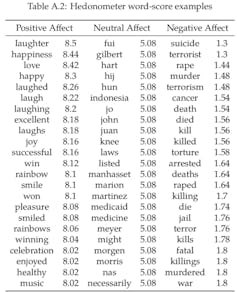
Its principle is simple but laborious to apply. It requires collecting a million geolocated tweets, identifying for each and every author over time the words expressing a feeling of well-being and ill-being and translating them into a synthetic score. The trickiest phase is of course to choose among the terms used, the words with positive and negative connotations, and to give them a value to calculate the score.
In order to obtain more solid results, several methods were used including one observing and analyzing even emoticons in addition to words. It is then enough to relate this taking of the temperature of the feelings to the temperature of the day of the written messages.
The curve obtained by Patrick Baylis resembles an inverted U. At the top, a plateau between 14°C and 28°C, a steady rise to reach it starting from 0°C and a descent from 28°C to around 42°C. We therefore still notice an increase in well-being when the temperature is a little less cool, a kind of happiness from the heat.
Of course, this universal curve should not be believed. It was established from data collected in the United States. This huge country has the advantage of a great diversity of climatic conditions. From the cold of Alaska to the high temperatures of Arizona to the humid heat of New Orleans and the temperate climate of Wisconsin. But the economic, cultural and social particularities of this region of North America make it more than difficult to extrapolate the trends observed to the rest of the world.
88% of US homes, for example, are equipped with an air conditioner . Aware of this difficulty, Patrick Baylis had the good idea to apply his hedonometer to six other English-speaking countries. The inverted U, that is, the preference for moderate temperatures over cold or hot temperatures, is found in Australia and India.
In contrast, in South Africa and the Philippines, the U is missing a leg: low temperatures are no less preferred than moderate temperatures. For Kenya and Uganda, both legs disappeared altogether: no discernable difference in feelings expressed in response to different temperatures. We must therefore remain circumspect. Especially since, apart from Australia, Twitter users in these countries represent a small and particular portion of the population, because they are more affluent and educated.
Forget Celsius and Fahrenheit!
It’s also worth keeping in mind that temperature alone doesn’t determine our feelings about the weather outside. Humidity also plays a role, especially when the temperature is high. It blocks the evacuation of body heat through sweating, which increases the risk of heat stroke.
Gray weather, even if the temperature is mild and there is no rain, also influences our mood. Highlighting the role of temperature, all other things being equal, therefore requires taking into account, either technically in econometrics, controlling these other variables describing climatic conditions.
Our young economist has taken rain into account in his calculations and his curve, ie the effect of temperature is estimated whether or not it is raining elsewhere. This is not completely the case for sunshine which is not taken into account as such and which rain does not sum up. The weather can be gray without rain. And it rarely rains when the sun is shining, very fortunately because on that day the devil beats his wife and marries his daughter according to the saying inherited from a famous argument between Jupiter and Juno.
To better establish the links between temperature and happiness, we should abandon the scales developed by Anders Celsius and Gabriel Fahrenheit at the beginning of the 18th century, abandon the mercury thermometer of yesterday and the gallium of today to adopt the wet bulb globe.

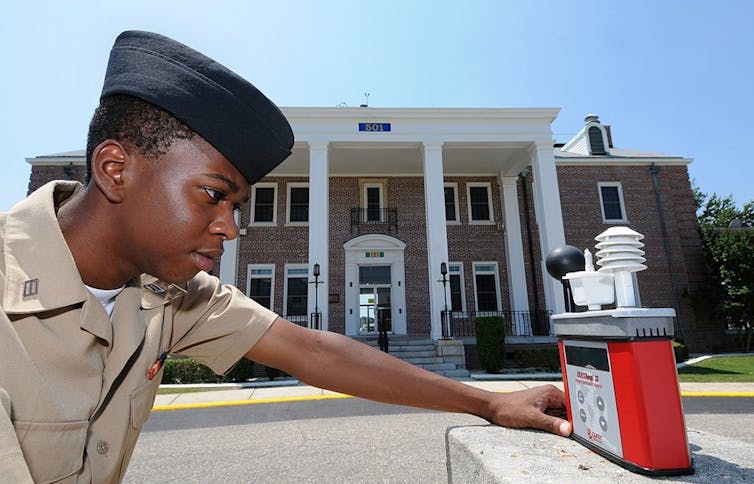
This funny instrument calculates according to the humidity of the moment the wet temperature (that is to say the one that prevents the evaporation of sweat), determines the radiant temperature thanks to a small black ball exposed to daylight , and finally more banally measures the temperature of the ambient air. All it needs is an anemometer to observe the wind speed! It combines the three observations to obtain a value in degrees WBGT (for Web Bulb Globe Temperature). The device is used in particular on certain military bases and construction sites to assess the level of risk of heat stress and recommend that the level of activity be slowed down or even stopped.
You too can equip yourself with this funny device. There are versions that are not too bulky and not very expensive. You can then build your personal database in order to scientifically assess your own well-being according to this plural temperature.

